May 5, 2025 | 5 Minute Read
The house may be worth $250,000 and it’s yours for $130,000. Would you buy it?
One of the most important skills in buying and selling real estate is accurately comping a property to determine its current and future ARV (After Repair Value) and renovation costs.

These figures will help you decide whether a deal makes sense as a flip or an alternative strategy. You will be guided by your analysis, which combines market knowledge, personal experience, and a degree of subjectivity. While data plays a critical role, success often depends on your confidence and ability to execute your chosen exit strategy.

There are many tools for comping properties, such as Zillow (free) and Propstream (subscription-based). However, the most reliable and widely accepted source is the Multiple Listing Service (MLS). Being a licensed agent gives you access to this powerful tool, which most appraisers rely on when pulling comps. While off-market data from sources like Propstream can be helpful, appraisers typically prioritize MLS data—making it my go-to resource for valuing properties.
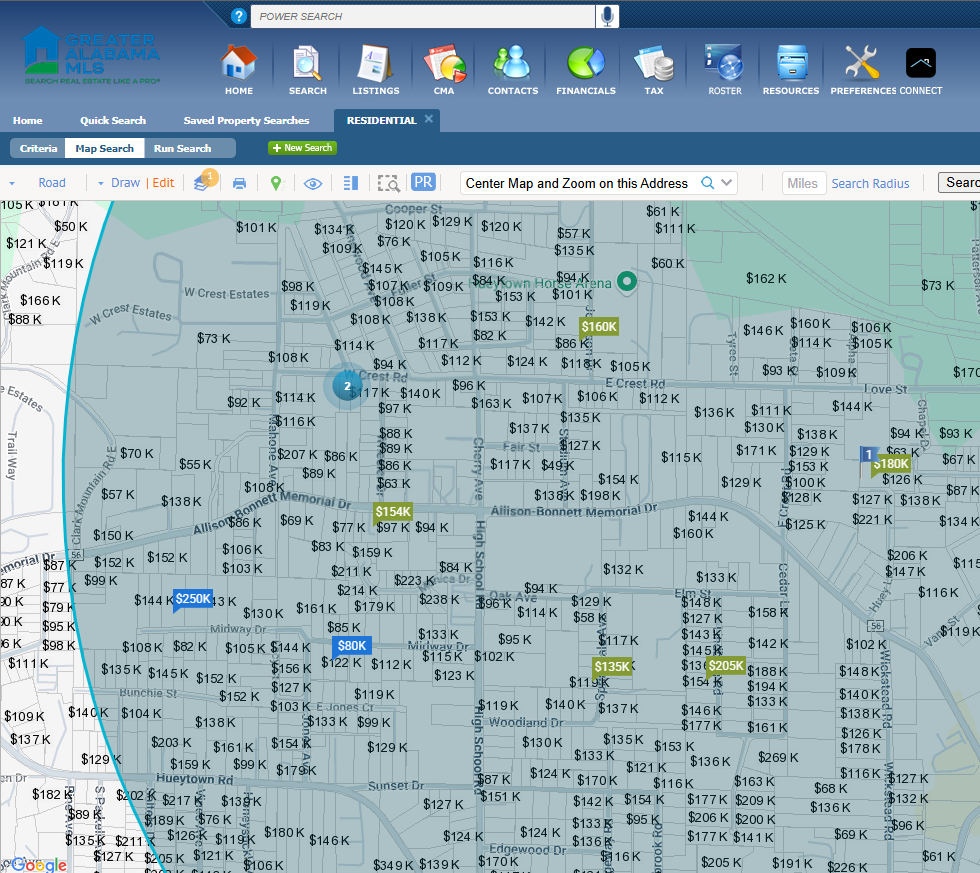
Let’s look at an example: a property I recently analyzed using MLS data in Hueytown, AL.

The listing agent originally priced the property at $225,000, but after five months on the market, it’s now listed at $179,900. What’s not obvious is that this is a short sale, and the agent just informed me she now has approval to reduce the price to $130,000. The bank is willing to accept 95% of a recent as-is appraisal of $125,000, which comes out to $118,750.
She’s given me a one-day window to consider the property before the price adjustment goes live. Based on the photos and information provided, the home will require significant updates. The kitchen, bathrooms, and fixtures are all outdated, suggesting the house was well lived in. That likely means the roof and HVAC system may need replacement. There’s also a strong possibility that both electrical and plumbing systems will require upgrades.
Given the scope, I’m setting an initial renovation budget of $50,000. This breaks down to roughly $25,000 for mechanical systems (roof, HVAC, plumbing, electrical), $20,000 for updating the kitchen, bathrooms, and general cosmetics, plus a $5,000 contingency for any latent defects (trust me, you will need it). This estimate is based on my experience flipping thousands of houses over the past 25 years. Estimating repairs is another article so we will not cover it here.
At first glance, I’m seeing comparable sales ranging from $175,000 to $250,000. Naturally, the potential for this property to appraise near the top of that range—around $250,000—has my adrenaline going. That would represent approximately $120,000 in equity. But there are quite a few high priced actives (green) so we might ask why so many and what the average DOM (days on market) is.
The home is a 4-bedroom, 2-bath property with an exterior carport, totaling 1,823 square feet. Built in 1960, it sits on nearly an acre of land and is conveniently located just minutes from major shopping centers and schools. Overall, it has strong potential.
When pulling comps, I focus on properties within a 400 sq. ft. size range, within 10 years of age, and located within a 1-mile radius—ideally in the same school district. I also consider some flexibility for 3-bed/2-bath properties with similar square footage. Features like garages can also influence comp selection and value adjustments.

Step 1: Reviewing Sold Comps
The first step in the valuation process is to analyze recent sales. Comps under $100,000 were all sold as-is for cash and do not reflect retail market value, so they are excluded from consideration.
Among the relevant comps:
One property sold for $133,000, but it was a 2 bed / 2 bath, 1,110 sq. ft. home—too small to be a true comparable.
Another sold for $250,000, but it’s a 4 bed / 3 bath, 2,558 sq. ft. property—significantly larger and not an appropriate comp.
A more useful comp sold in February for $174,900. It’s a 2 bed / 2 bath, 1,466 sq. ft. home built in 1998. While smaller and newer, it still falls within a reasonable range and helps to establish a conservative baseline value.
Step 2: Reviewing Contingent Listings
There is one notable contingent comp:
A 4 bed / 3 bath home listed at $210,000. It closely matches our subject in size and is about 10 years older. It includes a one-car garage and an additional bathroom. However, it hasn’t been fully renovated—updates appear limited to refinished hardwood floors and fresh paint.
If this property sells at list price, and considering the $174,900 sold comp, the estimated market value per square foot comes to $117.75. Applied to our 1,823 sq. ft. subject, that suggests a projected ARV of approximately $214,500 if fully renovated.
Step 3: Reviewing Active Listings
Currently, there are 11 active listings, but only one is a strong comp:
A 3 bed / 2.5 bath home listed at $205,000, just listed a week ago. It’s nearly identical in size and age and appears to have partial interior updates. This supports our projected value if I was to list today.
DOM is 63 days so properties are not moving as fast as I would like. Although a fully remodeled property is more desirable, with so many active listings, a slightly lower price to move the property may be a consideration.
Valuation Range
Based on the comps, I can reasonably project that if our subject property were fully renovated and listed today, it would justify a price between $205,000 and $215,000. That equates to an equity spread of $75,000 to $85,000, based on a potential purchase price of $130,000.
However, as always, market conditions are fluid. By the time renovations are complete in 3–4 months, the property’s value could shift anywhere between $185,000 and $230,000. This uncertainty is part of the calculated risk we take in weighing potential profit against market volatility.
Step 4: Next Step: Expanding the Data Set
My initial comp analysis only covered sales from the past six months. Given the limited data, I’ll now expand the search to include sales from the last 12 months to gain deeper insight to see if my projected pricing strategy is on target.

-
The two comps in Bessemer were excluded—they’re in a different city and school district.
-
Two Hueytown comps sold between $189,900 and $214,000, reinforcing our estimated list price range of $205,000 as realistic.
Profit and Offer Analysis
Let’s break down the numbers based on a conservative offers coming in at $200,000 (priced slightly lower due to DOM):
-
Seller concessions: $5,000
-
Agent commissions: $4,000
-
Closing costs: $2,500
-
Net proceeds: approximately $188,500
Cost Breakdown:
-
Purchase price: $130,000
-
Renovation budget: $50,000
-
Holding costs (6 months at 12% interest + 3 points, closing costs x 2 and commissions): ~$18,000
-
Total Investment: ~$198,000
At that point, you’re potentially losing money, or at best, breaking even.
To make this a profitable flip, I calculated my maximum allowable offer as follows:
$200,000 ARV × 70% = $140,000 – $50,000 renovation = $90,000 offer price
That 70% ARV formula accounts for closing costs and hard money financing. Based on this structure, the estimated profit margin would range between $27,000 and $35,000, depending on the financing source—private lender, hard money, or bank loan.
Renovation Cost Drives the Deal
The truth is in the numbers. A wide equity spread doesn’t always equal a deal. The renovation budget always drives the final price. If this property only needed $15,000 in repairs, my offer would’ve been around $105,000—still well below the $118,750 the bank wants.
After reviewing everything, I advised the listing agent that while the property is in decent enough shape, at $130,000, it’s most suitable for an owner-occupant, assuming it passes inspection and contingency hurdles.
One Day Later…
That’s exactly what happened. The listing agent received an offer from an owner-occupant buyer.
So, a good deal for a homeowner but definitely not one for investors.